Visiting
Madeira weather month by month, at three different stations
The short answer
IPMA publishes standalone climate normals for only two stations in the whole Madeira archipelago, Funchal and Porto Santo. Figures for the north coast and the mountains exist only inside IPMA’s monthly regional bulletins, and that series began in January 2026, so it covers January to July and no further.
Santana rainfall, January
106.9 mm
Derived from the observation and anomaly stated in the IPMA regional bulletin.
IPMA, 1991–2020 normal · check it · read August 26, 2026Chão do Areeiro rainfall, January
225.4 mm
Derived from the observation and anomaly stated in the IPMA regional bulletin.
IPMA, 1991–2020 normal · check it · read August 26, 2026Santana mean daily maximum, January
16.1 °C
Derived from the observation and anomaly stated in the IPMA regional bulletin.
IPMA, 1991–2020 normal · check it · read August 26, 2026Chão do Areeiro mean daily maximum, January
8.7 °C
Derived from the observation and anomaly stated in the IPMA regional bulletin.
IPMA, 1991–2020 normal · check it · read August 26, 202643 more sourced figures on this page
Santana rainfall, February
129.1 mm
Derived from the observation and anomaly stated in the IPMA regional bulletin.
IPMA, 1991–2020 normal · check it · read August 26, 2026Chão do Areeiro rainfall, February
245.8 mm
Derived from the observation and anomaly stated in the IPMA regional bulletin.
IPMA, 1991–2020 normal · check it · read August 26, 2026Santana rainfall, March
117.5 mm
Derived from the observation and anomaly stated in the IPMA regional bulletin.
IPMA, 1991–2020 normal · check it · read August 26, 2026Chão do Areeiro rainfall, March
252.8 mm
Derived from the observation and anomaly stated in the IPMA regional bulletin.
IPMA, 1991–2020 normal · check it · read August 26, 2026Santana mean daily maximum, March
16.7 °C
Derived from the observation and anomaly stated in the IPMA regional bulletin.
IPMA, 1991–2020 normal · check it · read August 26, 2026Chão do Areeiro mean daily maximum, March
9.7 °C
Derived from the observation and anomaly stated in the IPMA regional bulletin.
IPMA, 1991–2020 normal · check it · read August 26, 2026Santana rainfall, April
84.5 mm
Derived from the observation and anomaly stated in the IPMA regional bulletin.
IPMA, 1991–2020 normal · check it · read August 26, 2026Chão do Areeiro rainfall, April
166.6 mm
Derived from the observation and anomaly stated in the IPMA regional bulletin.
IPMA, 1991–2020 normal · check it · read August 26, 2026Santana rainfall, May
59.9 mm
Derived from the observation and anomaly stated in the IPMA regional bulletin.
IPMA, 1991–2020 normal · check it · read August 26, 2026Chão do Areeiro rainfall, May
92.2 mm
Derived from the observation and anomaly stated in the IPMA regional bulletin.
IPMA, 1991–2020 normal · check it · read August 26, 2026Santana rainfall, June
34.2 mm
Derived from the observation and anomaly stated in the IPMA regional bulletin.
IPMA, 1991–2020 normal · check it · read August 26, 2026Chão do Areeiro rainfall, June
39.7 mm
Derived from the observation and anomaly stated in the IPMA regional bulletin.
IPMA, 1991–2020 normal · check it · read August 26, 2026Santana rainfall, July
25.8 mm
Derived from the observation and anomaly stated in the IPMA regional bulletin.
IPMA, 1991–2020 normal · check it · read August 26, 2026Chão do Areeiro rainfall, July
14.3 mm
Derived from the observation and anomaly stated in the IPMA regional bulletin.
IPMA, 1991–2020 normal · check it · read August 26, 2026Santana mean daily maximum, July
22.0 °C
Derived from the observation and anomaly stated in the IPMA regional bulletin.
IPMA, 1991–2020 normal · check it · read August 26, 2026Chão do Areeiro mean daily maximum, July
19.1 °C
Derived from the observation and anomaly stated in the IPMA regional bulletin.
IPMA, 1991–2020 normal · check it · read August 26, 2026Funchal observatory station altitude
58 m
IPMA station 522, on the sheltered south coast.
IPMA, 1991–2020 · check it · read August 26, 2026Funchal annual mean daily maximum
22.9 °C
Annual mean daily minimum 17 °C.
IPMA, 1991–2020 · check it · read August 26, 2026Funchal annual rainfall
574.3 mm
The IPMA station normal for 1991–2020 at Funchal, Observatório (522). The regional hydrological study quotes a different long-run average for the same place over an unstated period; the two series are not interchangeable.
IPMA, 1991–2020 · check it · read August 26, 2026Funchal days a year above twenty-five degrees
104.1
Days with a maximum over 25 °C, 1991–2020 normal.
IPMA, 1991–2020 · check it · read August 26, 2026Porto Santo annual mean temperature
19.1 °C
Measured at IPMA station 524.
IPMA, 1991–2020 · check it · read August 26, 2026Santana station altitude
380 m
Approximate, as stated by IPMA in the regional bulletins.
IPMA, 1991–2020 normal · check it · read August 26, 2026Chão do Areeiro station altitude
1,590 m
Approximate, as stated by IPMA in the regional bulletins.
IPMA, 1991–2020 normal · check it · read August 26, 2026Mountain rainfall against Funchal, March
4.06 times
Chão do Areeiro against Funchal, from the two March rainfall normals published on this page.
IPMA, 1991–2020 normal · check it · read August 26, 2026North-coast rainfall against Funchal, July
15.18 times
Santana against Funchal, from the two July rainfall normals published on this page.
IPMA, 1991–2020 normal · check it · read August 26, 2026North-coast rainfall against Funchal, January to July
1.97 times
A derived figure. No single document publishes this ratio: Santana’s 557.9 mm and Funchal’s 283.7 mm are each the sum of the seven monthly values in the table on this page. Funchal’s months come from the station normals sheet, which is where this link goes; Santana’s come from seven monthly editions of the Boletim Climatológico, because IPMA publishes no standalone normals sheet for Santana.
IPMA, The Funchal half of the ratio; the Santana half is summed from the monthly Boletins · check it · read August 28, 2026IPMA stations in the archipelago with a published normals sheet
2
Funchal (522) and Porto Santo (524), out of fifty-seven stations nationally.
IPMA, The published 1991–2020 normals sheets, nationally · check it · read August 28, 2026Cross-checks of the derivation against IPMA published normals
21
All matched, with no mismatches.
IPMA, 1991–2020 normal · check it · read August 26, 2026Santana mean temperature, February
13.1 °C
The one derived value that does not sit within 0.05 °C of the midpoint of its own maximum and minimum. Carried at medium confidence.
IPMA, 1991–2020 normal · check it · read August 26, 2026Madeira has one weather forecast and at least three climates. The figure a visitor reads is almost always Funchal, measured at an observatory 58 m, source: IPMA, 1991–2020, read August 26, 2026 above the sea on the sheltered south coast, and it describes the north coast and the mountains about as well as a Brighton forecast describes Snowdonia.
The gap is measurable. Across January to July the north-coast station records 1.97 times, source: IPMA, The Funchal half of the ratio; the Santana half is summed from the monthly Boletins, read August 28, 2026 the rainfall of the Funchal station. In March the mountain station records 4.06 times, source: IPMA, 1991–2020 normal, read August 26, 2026 Funchal’s. In January Funchal’s mean daily maximum is 20.0 °C, source: IPMA, 1991–2020, read August 26, 2026 while the mountain station’s is 8.7 °C, source: IPMA, 1991–2020 normal, read August 26, 2026.
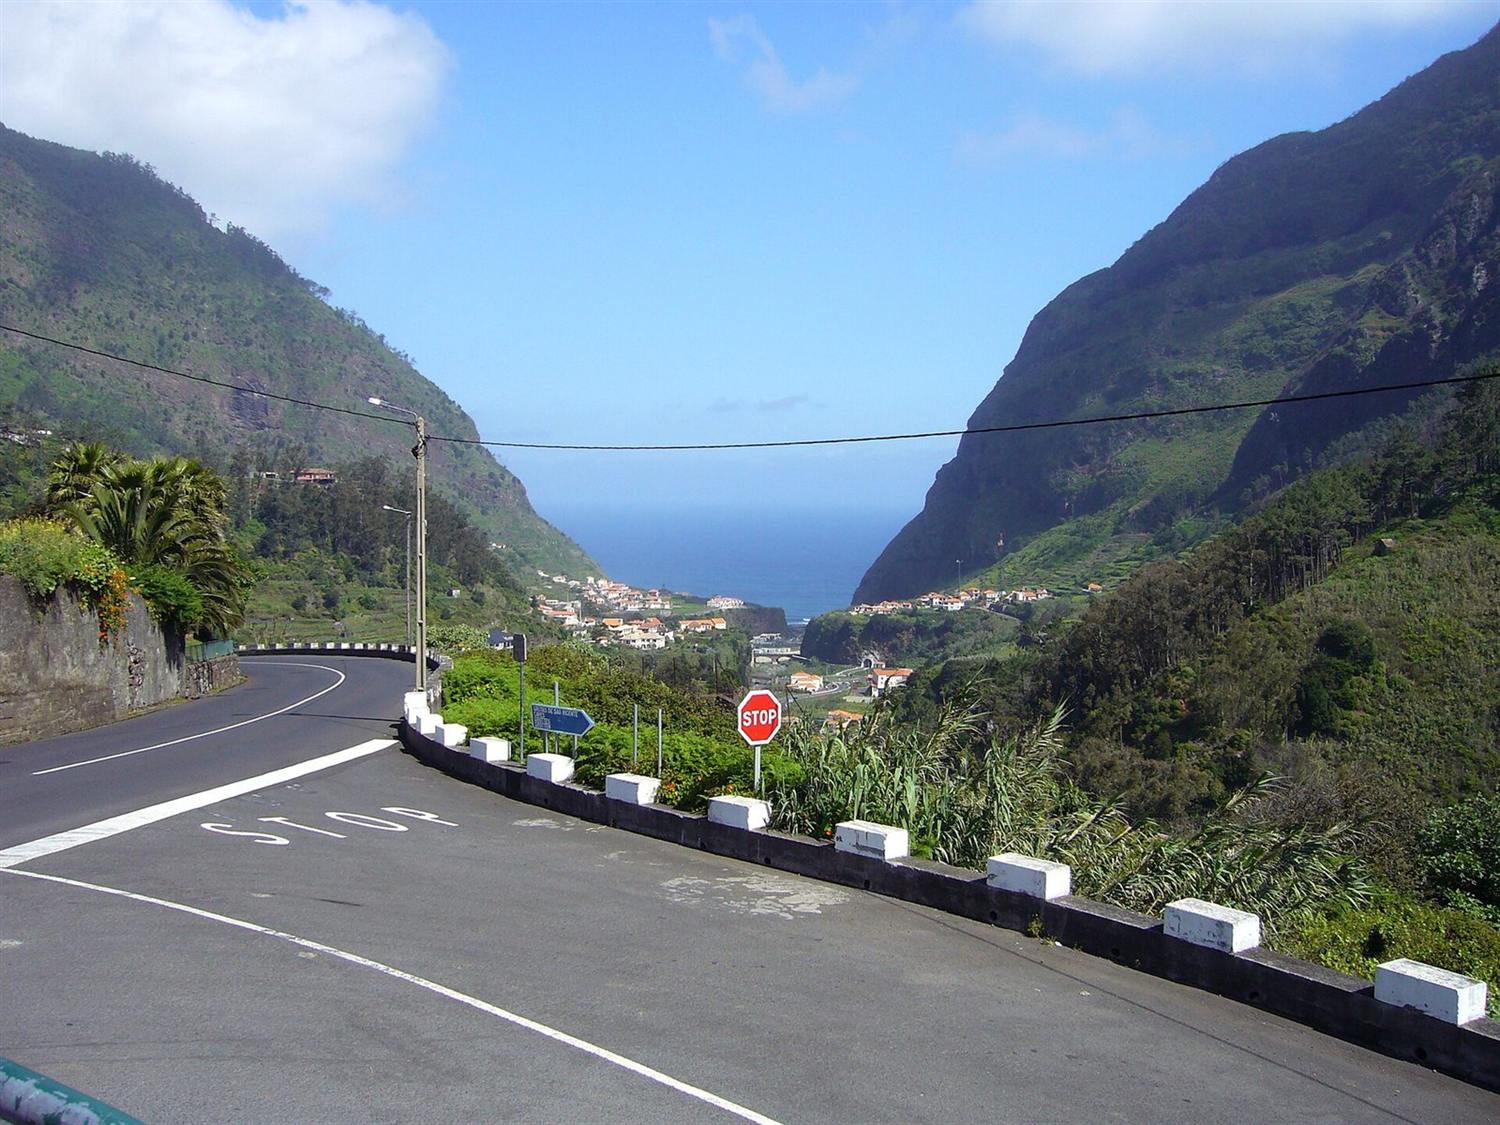
That is the whole island in three numbers, and it is why the north looks the way it does in the photographs.
Rainfall, month by month, at three stations
Every figure is the 1991 to 2020 normal. Funchal comes from IPMA’s published normals sheet. Santana and Chão do Areeiro are recovered from IPMA’s monthly regional bulletins, which is the only place they are stated at all.
The two right-hand columns stop after July. That is not an oversight, and the next section explains exactly why.
Why August to December are blank
IPMA publishes standalone climate-normal fact sheets for 2, source: IPMA, The published 1991–2020 normals sheets, nationally, read August 28, 2026 stations in the entire Madeira archipelago: Funchal and Porto Santo. That was checked across all three published normal periods. There is no published normals sheet for any north-coast or mountain station.
The only place those stations’ normals appear is inside the monthly Boletim Climatológico da Região Autónoma da Madeira, which states each month’s observation together with its anomaly against the 1991 to 2020 normal. Subtract the anomaly from the observation and the normal falls out.
That bulletin is a new series. It begins with the January 2026 edition, IPMA’s publications index holds exactly seven of them, and the July edition was published in August 2026. The August edition did not exist when these figures were read on 26 August 2026.
So August through December for Santana and Chão do Areeiro are not published anywhere. They are left blank rather than filled in from a secondary source, because a rainfall figure that cannot be clicked through to IPMA is worth nothing on a page like this. Every English-language competitor prints twelve months for the north coast. None of them can say where the last five came from.
How the north-coast and mountain figures were derived
The method is arithmetic on IPMA’s own statements: normal equals observation minus anomaly. Where a bulletin states a normal outright, the stated value was used in preference to the arithmetic.
How it was checked
The method was run 21, source: IPMA, 1991–2020 normal, read August 26, 2026 times against the two stations where IPMA does publish a normals sheet. For every month extracted, a Funchal or Porto Santo value was re-derived from the same bulletin by the identical method and compared against the published sheet. All of them matched.
As a second check, in thirteen of fourteen station-months the derived mean temperature equals the midpoint of the derived maximum and minimum to within a twentieth of a degree. The exception is Santana in February, where the derived mean is 13.1 °C, source: IPMA, 1991–2020 normal, read August 26, 2026 against a midpoint a quarter of a degree higher. That reflects IPMA’s own figures rather than an extraction error, and it is carried at medium confidence rather than quietly rounded away.
What IPMA says about its own series
IPMA notes in the bulletins that the Chão do Areeiro series uses WRF-modelled data for 1995 to 2002 for precipitation and mean temperature, and that the Santana series uses WRF-modelled mean temperature for 2005 to 2010.
These normals are therefore partly model-derived at source. That is almost certainly why IPMA publishes no normals fact sheet for either station, and it belongs on the page rather than in a footnote: the north-coast and mountain figures here are the best published figures that exist, not measurements of the same standing as the Funchal sheet.
The three climates, in plain terms
Funchal and the south
An annual mean daily maximum of 22.9 °C, source: IPMA, 1991–2020, read August 26, 2026, 574.3 mm, source: IPMA, 1991–2020, read August 26, 2026 of rain a year, and 104.1, source: IPMA, 1991–2020, read August 26, 2026 days a year above twenty-five degrees. July rainfall is 1.7 mm, source: IPMA, 1991–2020, read August 26, 2026, which is effectively nothing at all.
Santana and the north
Cooler by day in every month IPMA publishes: 16.1 °C, source: IPMA, 1991–2020 normal, read August 26, 2026 in January against Funchal’s 20.0 °C, source: IPMA, 1991–2020, read August 26, 2026, 16.7 °C, source: IPMA, 1991–2020 normal, read August 26, 2026 in March against 20.6 °C, source: IPMA, 1991–2020, read August 26, 2026, and 22.0 °C, source: IPMA, 1991–2020 normal, read August 26, 2026 in July against 25.4 °C, source: IPMA, 1991–2020, read August 26, 2026. Much wetter: 106.9 mm, source: IPMA, 1991–2020 normal, read August 26, 2026 in January against Funchal’s 67.1 mm, source: IPMA, 1991–2020, read August 26, 2026. In July, when Funchal records 1.7 mm, source: IPMA, 1991–2020, read August 26, 2026, Santana still records 25.8 mm, source: IPMA, 1991–2020 normal, read August 26, 2026, which is 15.18 times, source: IPMA, 1991–2020 normal, read August 26, 2026 as much. The station sits at roughly 380 m, source: IPMA, 1991–2020 normal, read August 26, 2026.
Chão do Areeiro and the mountains
At roughly 1,590 m, source: IPMA, 1991–2020 normal, read August 26, 2026 the mountain station runs between six and a third and eleven and a third degrees cooler than Funchal by day, across the seven months IPMA publishes. Its January mean daily maximum is 8.7 °C, source: IPMA, 1991–2020 normal, read August 26, 2026. Its March rainfall is 252.8 mm, source: IPMA, 1991–2020 normal, read August 26, 2026 against Funchal’s 62.3 mm, source: IPMA, 1991–2020, read August 26, 2026, and its March mean daily maximum is 9.7 °C, source: IPMA, 1991–2020 normal, read August 26, 2026. Its warmest month is not warm: the July mean daily maximum up there, 19.1 °C, source: IPMA, 1991–2020 normal, read August 26, 2026, is lower than Funchal’s in January.
Porto Santo
A separate island with a separate climate: an annual mean of 19.1 °C, source: IPMA, 1991–2020, read August 26, 2026 and annual rainfall of 381.7 mm, source: IPMA, 1991–2020, read August 26, 2026, against Funchal’s 574.3 mm, source: IPMA, 1991–2020, read August 26, 2026. It is drier than Funchal over the year and in every month from September to May. In June, July and August the order reverses, on almost no rain either way — Funchal records 7.8 mm, source: IPMA, 1991–2020, read August 26, 2026, 1.7 mm, source: IPMA, 1991–2020, read August 26, 2026 and 1.3 mm, source: IPMA, 1991–2020, read August 26, 2026 in those three months. That is why Porto Santo has the beach and Madeira has the forest.
What is deliberately missing
Sea temperature by month. No IPMA sea-surface temperature normals series for Madeira could be located, so there is no monthly sea series on this page. The only figure on any official page is one sentence from Porto Santo Line describing the sea at Porto Santo, and an operator’s sentence is not a twelve-month series.
Every competitor publishes a sea-temperature table. None of them cites a source for it. The gap here is the honest version of the same information.
What this means for planning a walk
Funchal weather does not predict a trailhead. A dry morning at 20.0 °C, source: IPMA, 1991–2020, read August 26, 2026 on the seafront can coincide with 8.7 °C, source: IPMA, 1991–2020 normal, read August 26, 2026 and rain on the ridge, where January rainfall runs more than three times Funchal’s. The north coast has its own, smaller ratio: 1.97 times, source: IPMA, The Funchal half of the ratio; the Santana half is summed from the monthly Boletins, read August 28, 2026 Funchal’s across January to July.
The practical shape of that is the ten-day route, which groups days by geography so the call is made from the window rather than after an hour in the car, and the individual entries under things to do, each of which carries its own season note and its own caveat. The permit regime that now governs every classified trail is set out in the guide to the levada walks, and the case for coming in February rather than August is in the winter guide.
Questions people actually ask
How much more rain does the north coast of Madeira get?
Across January to July, 1.97 times, source: IPMA, The Funchal half of the ratio; the Santana half is summed from the monthly Boletins, read August 28, 2026 as much as Funchal. In individual months the ratio ranges much wider, reaching 15.18 times, source: IPMA, 1991–2020 normal, read August 26, 2026 in July, when Funchal is effectively rainless and the north coast is not.
Why are there no north-coast figures for August to December?
Because IPMA does not publish them. Those stations have no standalone normals sheet, and the monthly regional bulletin that states their normals only began with the January 2026 edition. Seven editions exist. The rest of the year has no published source.
How cold does it get in the mountains on Madeira?
The Chão do Areeiro station at roughly 1,590 m, source: IPMA, 1991–2020 normal, read August 26, 2026 has a January mean daily maximum of 8.7 °C, source: IPMA, 1991–2020 normal, read August 26, 2026, against 20.0 °C, source: IPMA, 1991–2020, read August 26, 2026 in Funchal. That is a mean maximum rather than a minimum, and wind on an exposed ridge makes it feel worse.
What is the sea temperature in Madeira?
No figure is given here. No IPMA sea-surface temperature normals series for Madeira could be located, and the tables published elsewhere do not cite one either.
Which is the wettest month in Funchal?
Of the twelve monthly normals, December is highest at 94.8 mm, source: IPMA, 1991–2020, read August 26, 2026, with October close behind at 91.2 mm, source: IPMA, 1991–2020, read August 26, 2026. July at 1.7 mm, source: IPMA, 1991–2020, read August 26, 2026 is effectively rainless.
Where this came from
- IPMA: Normais climatológicas 1991–2020 — Funchal, Observatório (estação 522). ipma.pt/bin/file.data/climate-normal/cn_91-20_FUN Read August 26, 2026.
- IPMA: Normais climatológicas 1991–2020 — Porto Santo (estação 524). ipma.pt/bin/file.data/climate-normal/cn_91-20_POR Read August 26, 2026.
- IPMA: Boletim Climatológico da Região Autónoma da Madeira — January 2026. ipma.pt/resources.www/docs/im.publicacoes/edicoes Read August 26, 2026.
- IPMA: Boletim Climatológico da Região Autónoma da Madeira — February 2026. ipma.pt/resources.www/docs/im.publicacoes/edicoes Read August 26, 2026.
- IPMA: Boletim Climatológico da Região Autónoma da Madeira — March 2026. ipma.pt/resources.www/docs/im.publicacoes/edicoes Read August 26, 2026.
- IPMA: Boletim Climatológico da Região Autónoma da Madeira — April 2026. ipma.pt/resources.www/docs/im.publicacoes/edicoes Read August 26, 2026.
- IPMA: Boletim Climatológico da Região Autónoma da Madeira — May 2026. ipma.pt/resources.www/docs/im.publicacoes/edicoes Read August 26, 2026.
- IPMA: Boletim Climatológico da Região Autónoma da Madeira — June 2026. ipma.pt/resources.www/docs/im.publicacoes/edicoes Read August 26, 2026.
- IPMA: Boletim Climatológico da Região Autónoma da Madeira — July 2026. ipma.pt/resources.www/docs/im.publicacoes/edicoes Read August 26, 2026.
- IPMA: Normais climatológicas 1991–2020 — índice das estações publicadas. ipma.pt/pt/oclima/normais.clima/1991-2020/ Read August 28, 2026.